XYit 3.1
- Buy $89
- Developer Link 1 (non https xyit_installer.exe)
All files are original. Download3K does not repack or modify downloads in any way. Check MD5 for confirmation.
Quick Review
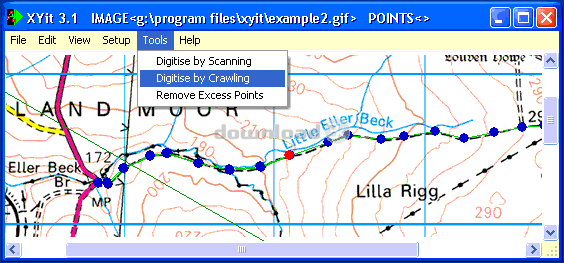
"Capture XY co-ordinates from charts & images."
XYit is a useful tool for grabbing the xy coordinates within images. The software can check between lines or different points in an image and determine the x and y coordinates. It is also possible to perform the reverse by using xy numerical information on an image to verify that the image conforms to this set of values. XYit is possibly best used by map makers who need to be specific about what scale they are using so that it conforms correctly to distance on a future map publication.
XYit Key Features:
- Measure the xy position in an image
- Use this information to help create UK Ordnance Survey, road maps or architectural plans
- Use set measurements and verify the distance matches the required values
- Scan images looking for pixels using the same color
- Automated line following software supporting both RGB or CMYK color modes
XYit is a xy coordinate tool that can help map makers confirm positions on a drawing to ensure maps are to scale.
Requirements: HDD:10MB RAM:256MB
What's new in this version: Improved help & automated digitising
Antivirus information
Popular downloads in Business & Finance
-
 Website Builder 9.0
This web site builder gives you everything y -
 PDF to Word | Solid Converter 10.1
Convert PDF to Word -
 Real Estate Price Calculator 3.0.1.5
Lands area length converter price calculator - Face Recognition System 2.0
Matlab source code for Face Recognition. -
 WPS Office Free 12.2.0.20326
Perfect free for creating & editing documents -
 to DBF Converter 3.16 - Allows you to convert XLS files to DBF format") XLS (Excel) to DBF Converter 3.16
XLS (Excel) to DBF Converter 3.16
Allows you to convert XLS files to DBF format -
 vCard Wizard 4.25
Transfer any Contacts. vCard vcf converter - Bill Maker 1.0
Bill, Invice, Inventory management -
 OEE 2
OEE 2
OEE calculator for MS Excel -
 Foxit Reader 10.0.0.35798
Protects Against Security.The Best PDF Reader